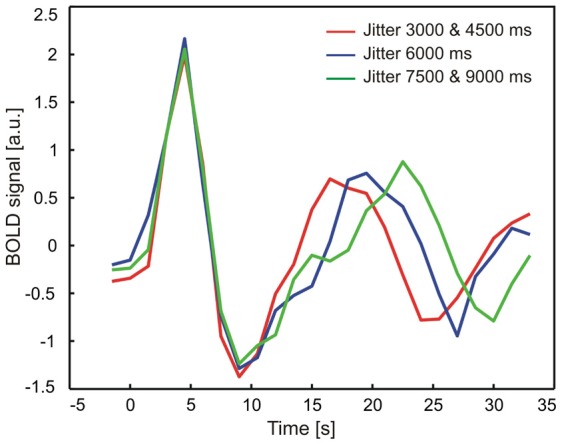
Figure A1.

Mean time course of neural activity in auditory cortex as a function of jitter between sound and reward presentation. In a model-free approach, individual time courses were extracted and time locked to the sound presentation in a sphere of radius 6 mm around the peak maximum activation in the right auditory cortex [x, y, z] = [50, −2, 4]. Time courses were grouped according to different jitter lengths (red: 3000, 4500 ms, blue: 6000 ms, green: 7500, 9000 ms) to visualize the time course during sound as well as feedback presentation. The results of this analysis clearly showed that there is no major contamination of the measured brain activity during feedback presentation which resulted from the sound presentation.
