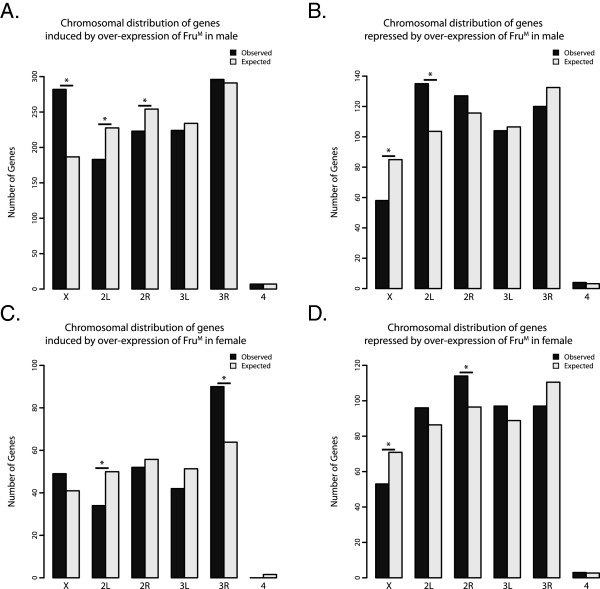
Figure 4.
Chromosomal distributions of genes regulated by FruM. (A-D) Observed (black) and expected (grey) number of genes on each chromosome for the sets of genes induced and repressed by over-expression of FruMA, FruMB, and FruMC in males or females. Asterisks indicate significant enrichment or depletion between observed and expected (Fisher’s exact test, p-value < 0.05).

