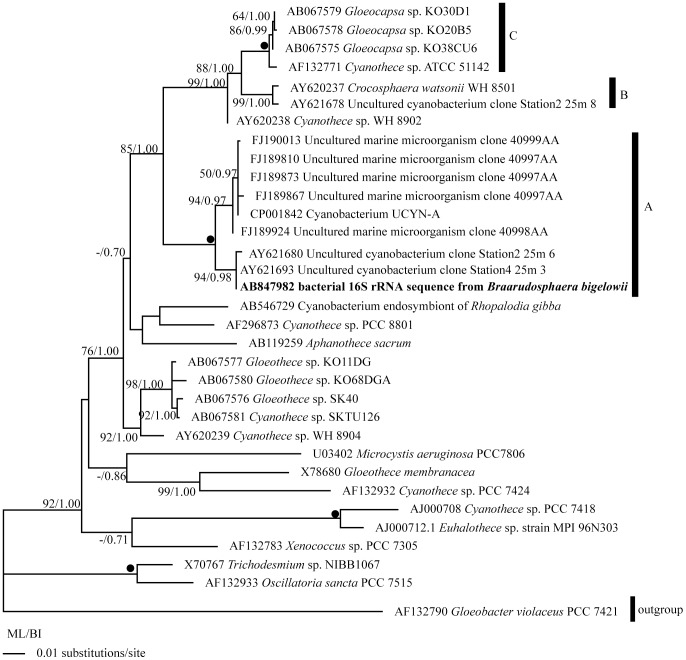
Figure 6. Phylogenetic tree based on 16S rDNA sequences using the Maximum Likelihood method.
Gloeobacter violaceus was used as an out-group. The numbers on each node indicate the bootstrap values from ML analysis and posterior probability of BI analysis. Clade names A, B, and C refer Taniuchi et al.[32] Solid circles indicate the clades supported by very high bootstrap values (100%) and posterior probability (1.00) by all analyses (ML, NJ, MP, and BI).

