
Figure 4.
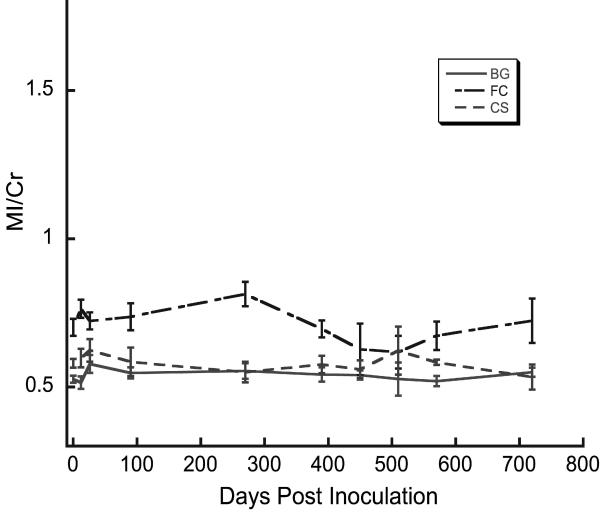
Longitudinal cerebral MI/Cr ratios in SIV-infected macaques. Values of MI/Cr obtained from the three measured brain regions are displayed. For the duration of the study ANOVA revealed no significant changes in the ratios for the three brain regions. Experimental details and plot legends as in Figure 2.