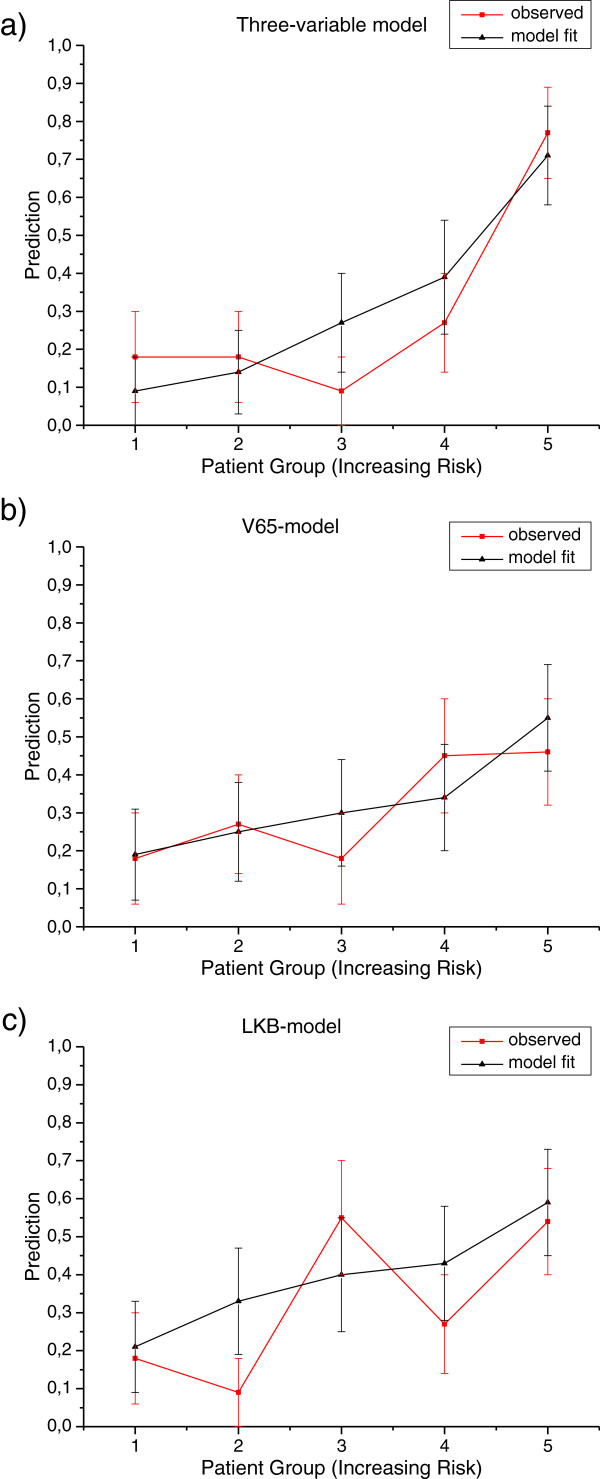
Figure 4.
Mean predicted rates of GI toxicity vs. observed rates for patients binned by predicted risk. The patients are binned, with equal patients number in each bin, according to the three-variable NTCP model (a), to the V65-based NTCP model (b), and to the LKB NTCP model (c). Continuous line: observed risk; dot lines: prediction model.

