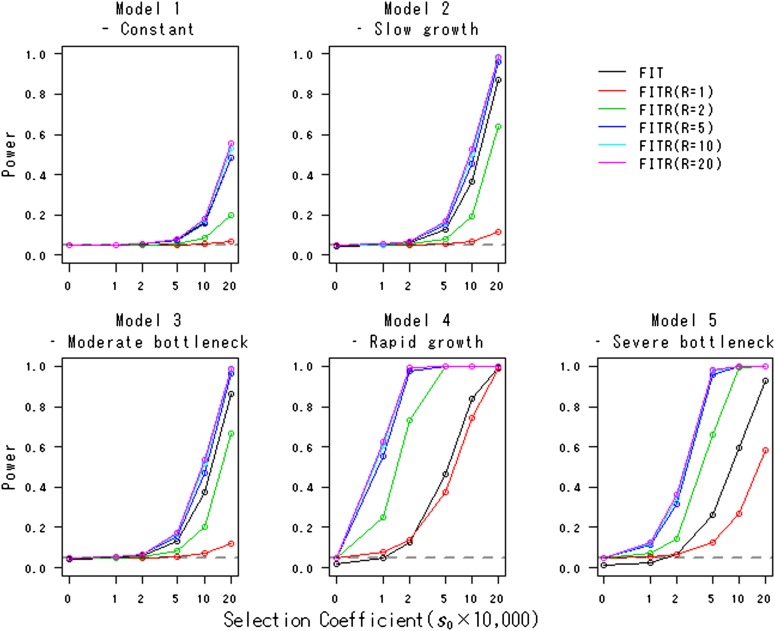
Figure 2.
Powers of the FITR and the FIT in various demographic models. Powers of the FIT (black line) and the FITR with R reference loci (colored lines) are shown as functions of the selection coefficients in the five demographic models. Each point corresponds to the power obtained by 100,000 simulations at the 5% significance level. The duration of sampling time and the number of sampled points were T = 1000 and (L + 1) = 11, respectively. The intervals between any two adjacent sampled points were the same at . The initial frequency for all R+ 1 loci, , was assumed to be 0.5.

