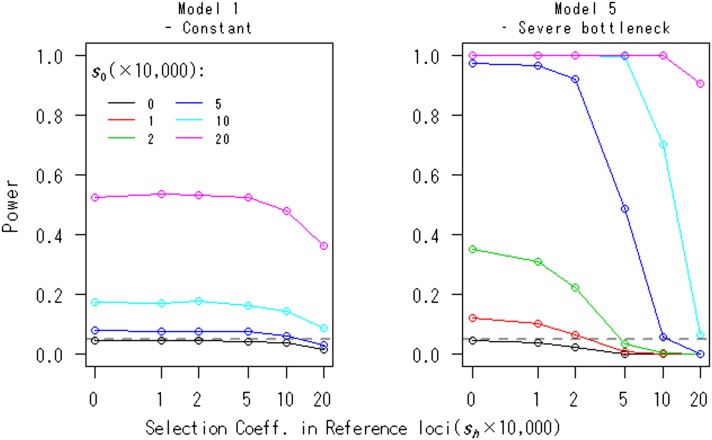
Figure 4.
The effects of selection at reference loci on the power of the FITR. The powers of the FITR under various selection strengths, s0, at focal loci are shown as functions of the selection coefficient, , at reference loci for demographic models 1 and 5. Each point corresponds to the power obtained by 100,000 simulations at the 5% significance level. The number of reference loci, the duration of sampling time, and the number of sampled points were R = 10, T = 1000, and (L + 1) = 11, respectively. The intervals between any two adjacent sampled points were the same at . The initial frequency for all loci, , was assumed to be 0.5.

