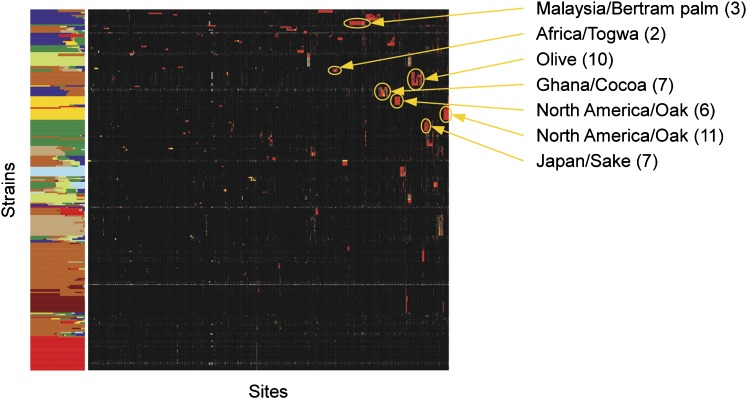
Figure 5.
Subpopulations defined by clustering of low frequency alleles. Two-dimensional hierarchical clustering of low frequency sites and strains. InStruct assignments, from Figure 2, are shown on the left, clustered genotypes are shown in the middle, with minor alleles in red, heterozygous sites in yellow, common alleles in black, and missing data in gray. Selected subpopulations are labeled on the right.

