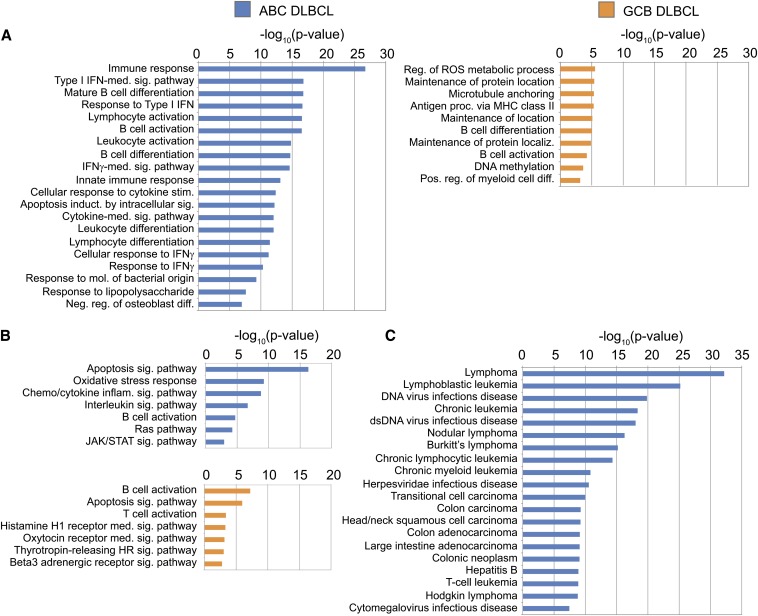
Figure 4.
ChIP-Seq BR enrichment for ontological categories. Scale is the –log10(P-value) of the binomial P-value, equivalent to the exponent. (A) All enriched GO Biological Processes, P < 0.05. (B) All enriched PANTHER Pathways, P < 0.05. (C) All enriched Disease Ontology listings, P < 0.05. Data shown for ABC only, as GCB had no significantly enriched categories.

