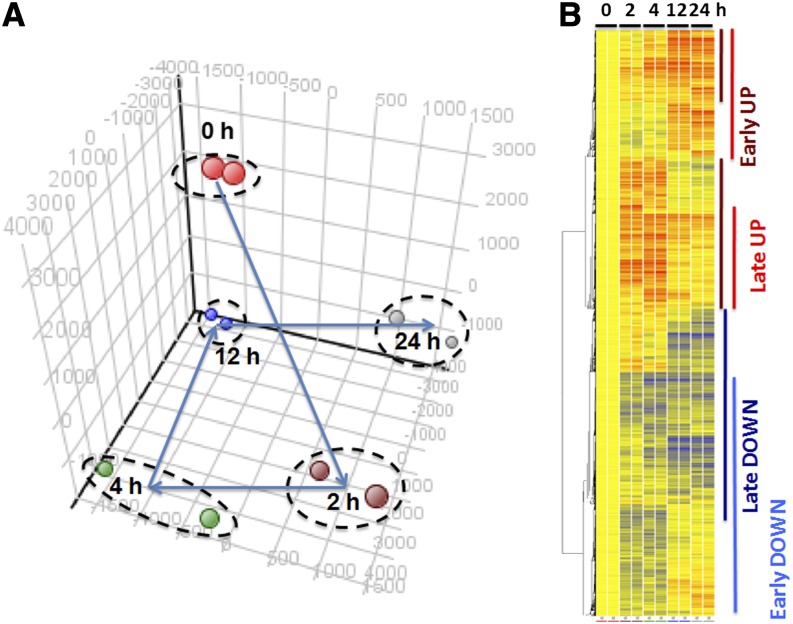
Figure 2.
Global analysis of RNA expression data during FGF2-induced lens fiber cell differentiation. (A) PCA of the RNA expression data. (B) Clustering of RNA expression profiles visualized as heat map diagram. Vertical bars: “Early UP” group, dark red; “Late UP” group, red; “Early DOWN” group, light blue; “Late DOWN” group, dark blue. The analysis of miRNAs is shown in Figure S1.

