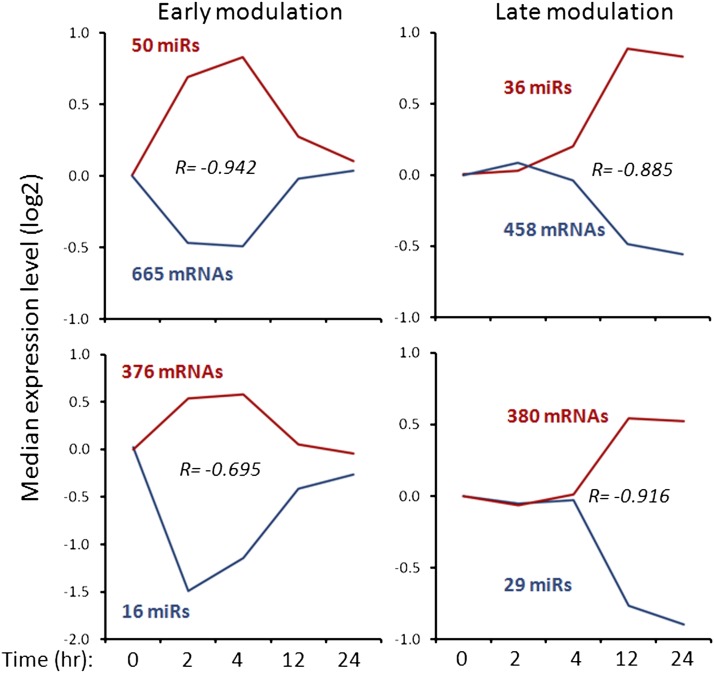
Figure 3.
Correlation between RNA and miRNA expression profiles during FGF2-induced lens fiber cell differentiation. Global analysis (Table 1) identified specific up- and down-regulated miRNAs at individual time points followed by computational programs to identify their target genes and analysis of expression profiles of these presumptive RNA targets. Median log2 values for each expression profile group are plotted as representative patterns with the underlying numbers of miRNAs and mRNAs indicated. R = Pearson product moment correlation coefficient indicates inverse correlation between the median-based profiles for miRNAs and mRNAs. The inversely correlated genes are shown in File S1, A and B.

