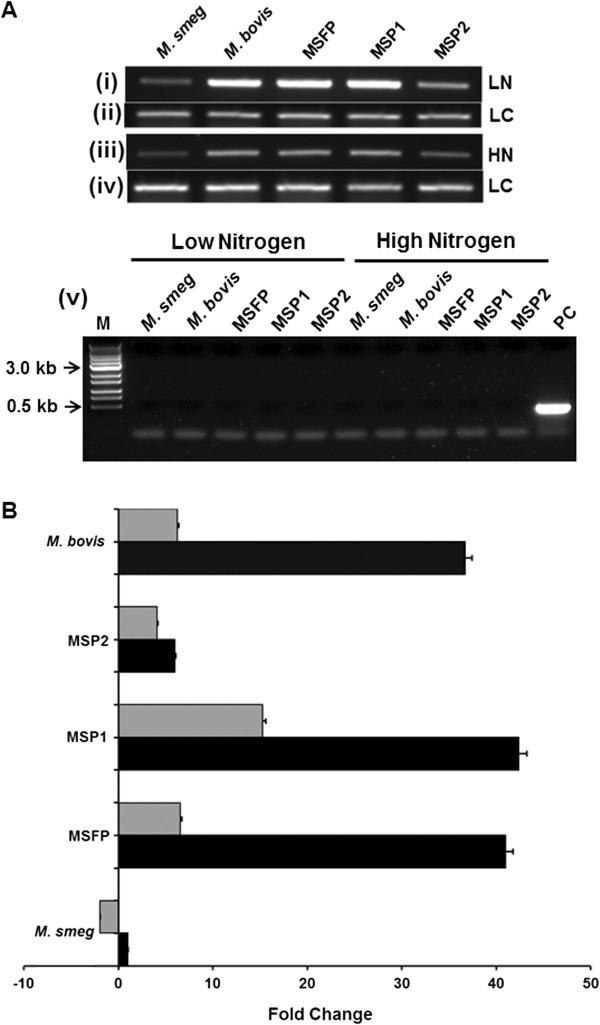
Figure 4.
Analysis of glnA1 transcription in mycobacterial strains in low and high nitrogen condition. A. For semi-quantitative reverse transcriptase PCR analysis, mycobacterial strains were grown in low and high nitrogen condition. glnA1 transcripts in (i) low nitrogen and (iii) high nitrogen condition. sigA loading control of respective test samples in low nitrogen (ii) and (iv) high nitrogen condition. (v) Genomic DNA contamination PCR analysis by sigA amplification without reverse transcriptase of respective test samples grown in low and high nitrogen condition. Lane M, marker; lane PC, positive control. B. For real-time (qRT-PCR) analysis, the expression profiles of glnA1 gene in low nitrogen (black bars) and high nitrogen (grey bars) conditions were compared with respect to their corresponding M. smegmatis wild-type strain in low nitrogen. Data shown are linear fold change normalized to sigA expression level. The transcripts were quantified by a SYBR Green-based real-time PCR assay as described under “Materials and Methods.” The experiments were repeated three times, and data from one of the representative experiments are presented. LN, low nitrogen; HN, high nitrogen; LC, loading control.

