
Figure 3.
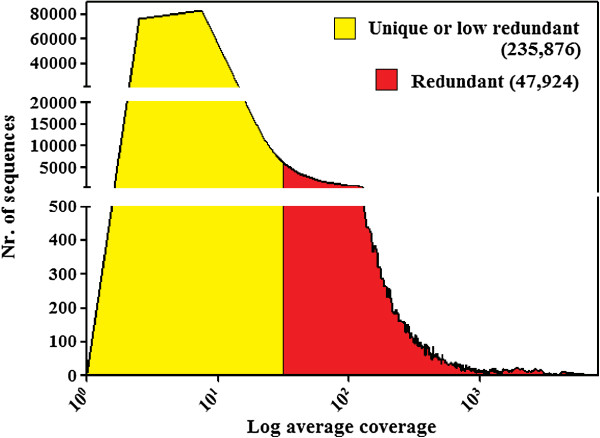
Distribution of mapped Illumina reads in the WGSAS. Sequences were subdivided into redundant and unique (low redundant), based on an arbitrary value corresponding to five-fold the mean average coverage of five putatively unique gene sequences.