
Figure 4.
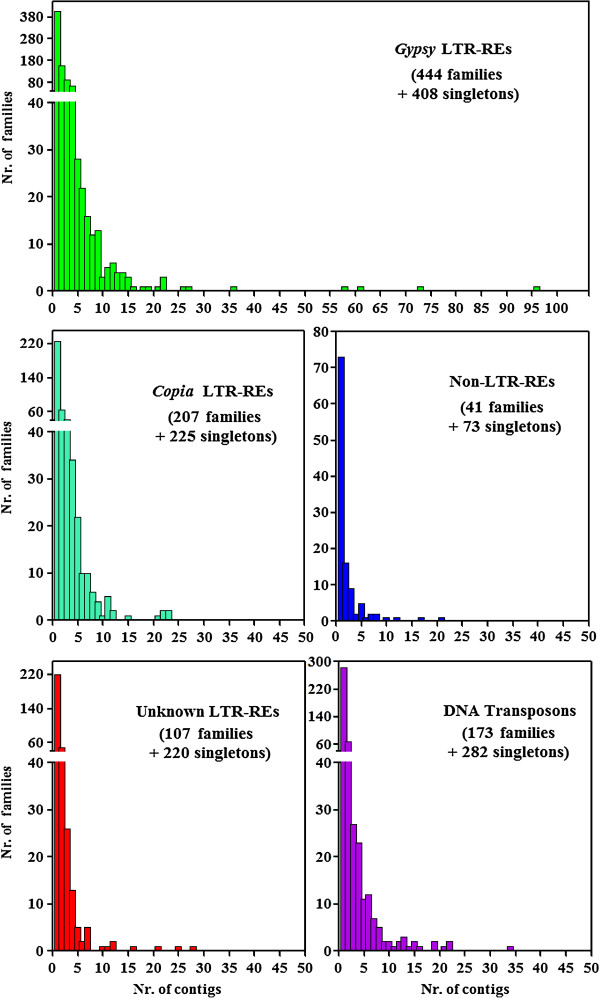
Size distribution of Gypsy, Copia, and unknown LTR REs, of non-LTR REs, and of DNA transposons families obtained performing an all-by-all BLAST analysis. For each superfamily, the histograms depict the number of families (Y-axis) containing a specified number of contigs. The total number of families and singletons (i.e. families represented by one contig) are also reported.