
Figure 2.
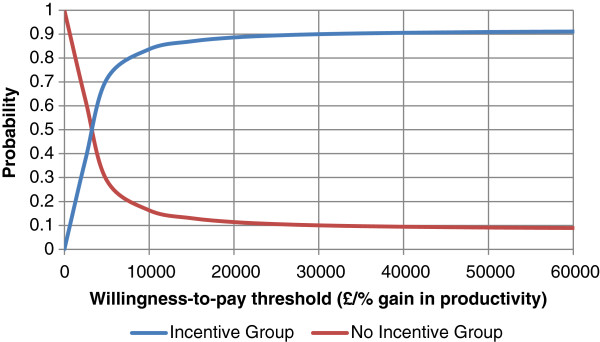
Cost-effectiveness acceptability curves for productivity gained for the Incentive and No Incentive Group.
Official websites use .gov
A
.gov website belongs to an official
government organization in the United States.
Secure .gov websites use HTTPS
A lock (
) or https:// means you've safely
connected to the .gov website. Share sensitive
information only on official, secure websites.
Cost-effectiveness acceptability curves for productivity gained for the Incentive and No Incentive Group.