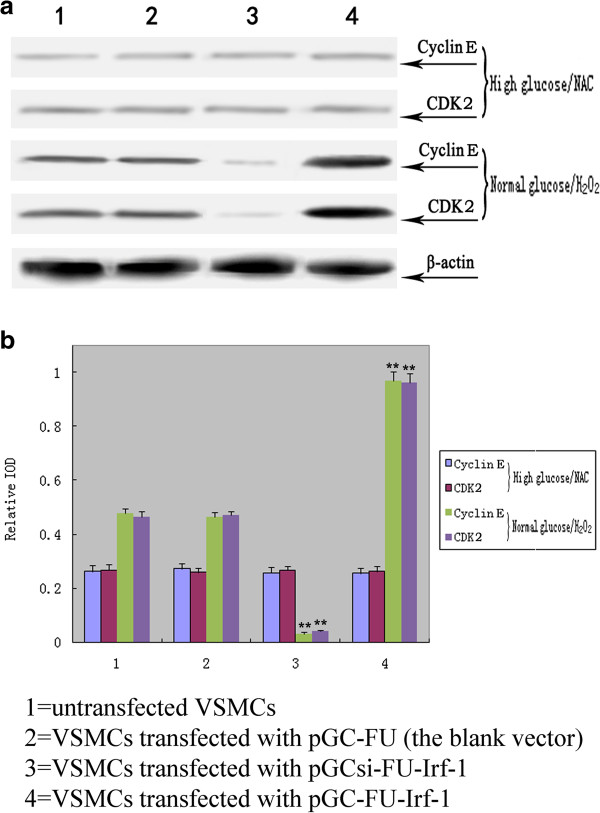
Figure 5.
Western blot analysis of cyclin E and CDK2 in transfected VSMCs following treatment with NAC or H2O2. a: Western blot analysis of the expression of cyclin E and CDK2 protein levels in transfected VSMCs; b: quantitative assessment of cyclin E and CDK2 protein levels through integrated optical density analyses. High glucose/NAC = cells incubated with high glucose and NAC for 5 days; normal glucose/H2O2 = cells incubated with normal glucose and H2O2 for 5 days. *P <0.05; **P <0.01 versus corresponding values in untransfected VSMCs.

