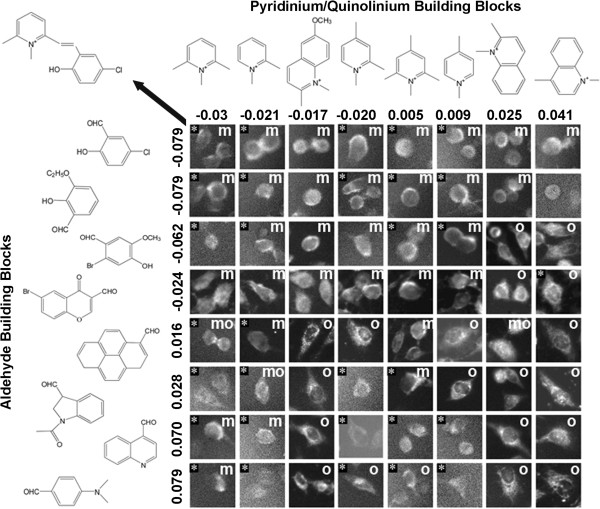
Figure 8.
Visualizing the relationship between cellular staining patterns and the calculated additive regression coefficients associated with each of the building blocks. Different aldehyde building blocks were plotted in rows (left) and pyridinium or quinolinium building blocks were plotted in columns (top). The numbers indicate the magnitude and sign of the regression coefficient, based on the measured coefficient of variation of cell associated pixel intensities. To assemble figures, individual cells representing the staining patterns observed in each image were manually cut from the images, and labeled based on their apparent organelle (o), membrane (m) or nuclear (n) staining patterns. Cells from images lacking significant signal or ambiguous in localization patterns were not labeled. Images that were excluded from regression analysis based on saturation or lack of cell-associated signals were included for visualization and tagged with an asterisk (*). The arrow points to the structure diagram of the styryl compound corresponding to the image in the upper left hand corner of the array.

