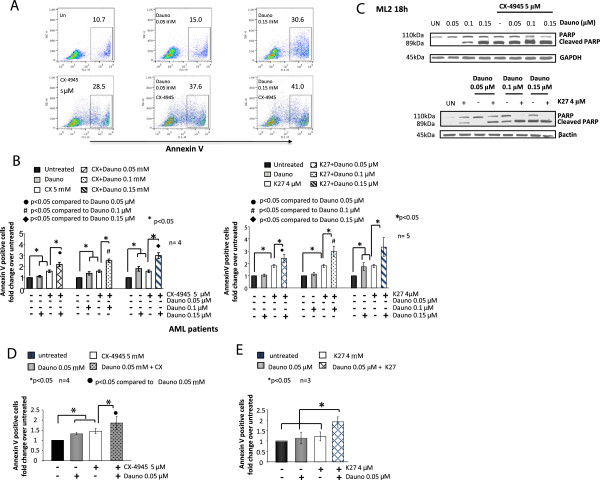
Figure 4.
CK2 inhibition empowers doxorubicin-induced apoptosis of AML cells. (A) Representative dot plot graph depicting the rate of apoptosis assessed by annexin V staining and FACS analysis of ML2 cells treated with two increasing concentrations of daunorubicin (0.05 and 0.15 μM) without or with a fixed dose of CX-4945 (5 μM). (B) Graphs showing ML2 AML cell apoptosis assessed by annexin V staining and FACS analysis in the presence of increasing concentrations of daunorubicin (0.05-0.15 μM) and CX-4945 (leftmost) or K27 (rightmost) kept at the fixed concentrations of 5 μM and 4 μM, respectively. (C) Representative immunoblot analysis of PARP cleavage in ML2 cells untreated or treated with increasing concentrations of daunorubicin (0.05-0.15 μM) without or with a fixed subapoptotic dose of CX-4945 (5 μM, top panels) or K27 (4 μM, bottom panels). (D, E) graphs summarizing data on the rate of apoptosis as assessed by annexin V staining and FACS analysis of freshly isolated AML blasts treated in the presence of daunorubicin (0.05 μM), CX-4945 5 μM or both (D) or daunorubicin (0.05 μM), K27 4 μM or both (E). In all the experiments data represent mean ± SD, n = 3-4. * indicates p < 0.05. β-actin and GAPDH were used as a protein load control in the immunoblot experiments.

