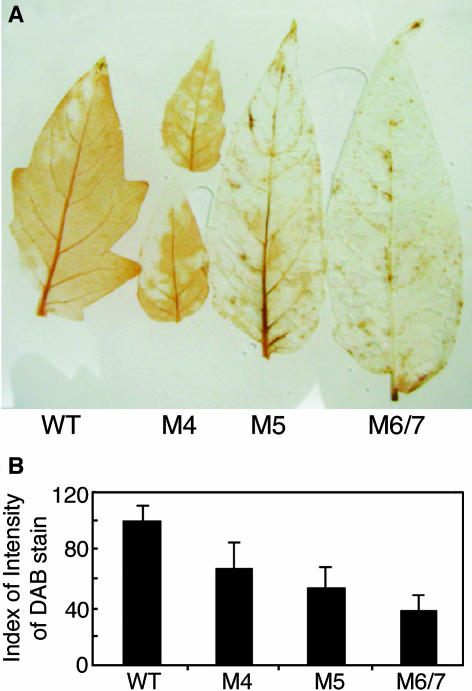
Figure 2.
H2O2 Production in Wild-Type and Antisense Leaves.
(A) Constitutive levels of H2O2 in leaves were visualized by DAB staining of the terminal leaflet of the first fully expanded leaves sampled from wild-type and Rboh transgenic 45-d-old plants. Leaflets were collected and vacuum-infiltrated with the DAB solution. The sampled leaves were placed in a plastic box under high humidity for DAB-H2O2 staining development.
(B) Quantitative analysis of DAB staining. Quantitative measurements were performed as described in the Methods. Each point represents the mean of four terminal leaflets derived from four different plants. Bars represent se.

