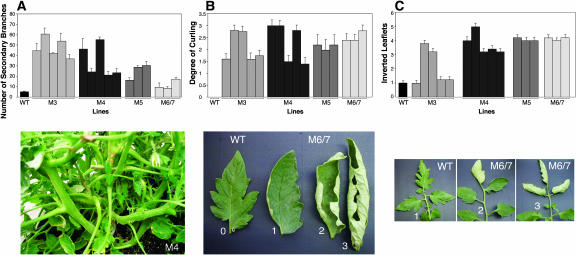
Figure 3.
Characterization of Vegetative Growth of Rboh Antisense Plants.
(A) Top panel, quantitative chart of appearance of secondary branches in wild-type and antisense plants. Each column represents an independent antisense line. Bottom panel, antisense plant line M4 showing a bushy phenotype.
(B) Top panel, quantitative chart of appearance of leaf curl in wild-type and antisense plants. Each column in the chart represents an independent antisense line. The analysis was performed using a 0 to 3 severity score as shown in the bottom panel, with 0 representing the wild type and 3 representing the most severe curling.
(C) Top panel, quantitative analysis of inverted leaflets in wild-type and antisense plants. Each column in the chart represents an independent antisense line. The analysis was performed using a 1 to 5 severity score (see Methods). The bottom panel illustrates wild-type leaflets and leaflets from an antisense line.

