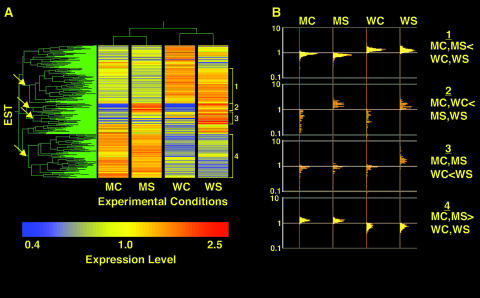
Figure 7.
Microarray Analysis of Leaves of Nonwounded Plants and the Systemic Leaves of Wounded Plants from Wild-Type and Transgenic M6/7 Lines.
(A) Double clustering analysis of transcripts showing a change in expression level (one-way ANOVA equal variance, P ≤ 0.05) in either control or systemic leaves of wild-type or antisense plants in the four experimental conditions. Each condition is the averaged result of two to three independent biological replicates. The conditions are as follows: MC, mutant control leaf; MS, mutant systemic leaf; WC, wild-type control leaf; WS, wild-type systemic leaf. The arrows point to selected clusters that are assigned numbers (brackets) corresponding to four groups (described in [B]).
(B) Log scale distribution of individual transcript activity in the selected groups.

