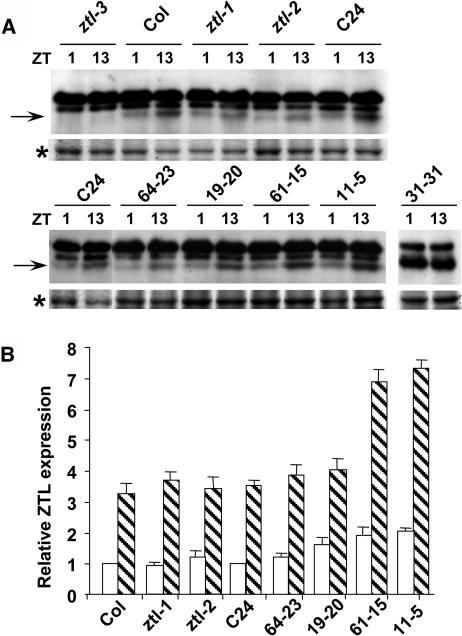
Figure 1.
Graded Series of ZTL Protein Expression.
(A) Immunoblots showing ZTL levels (arrows) at times of minimum (zeitgeber time 1 [ZT1]) and maximum (ZT13) accumulation (W.Y. Kim et al., 2003) in eight independent mutant and enhanced expression lines. Two nonspecific bands lie just above the ZTL-specific band. Representative region of Coomassie blue–stained gel of protein loadings equal those used for the immunoblots is shown below (*).
(B) Quantitation of ZTL levels in (A) at ZT1 and ZT13, adjusted for loading differences (*) and normalized to the appropriate wild-type (Col or C24) levels at ZT1. Mean values (±se) from three independent trials. Very high expresser (31-31; saturated signal) and ztl-3 (no signal) omitted in this analysis.

