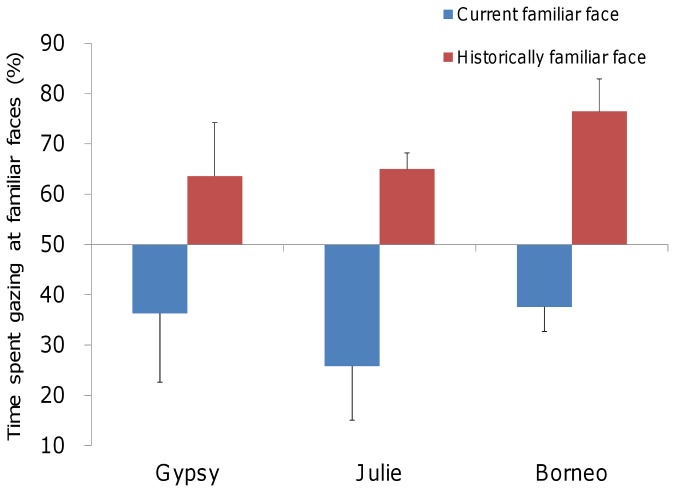
Figure 1. Mean (± SEM) preference scores for familiar faces.
The preference scores were calculated as percentages. Blue bars indicate the percentage of time spent gazing at currently familiar faces, and red bars indicate the percentage of time spent gazing at historically familiar faces. Gypsy, Julie, and Borneo are the orangutans used in this study.

