Figure 7.

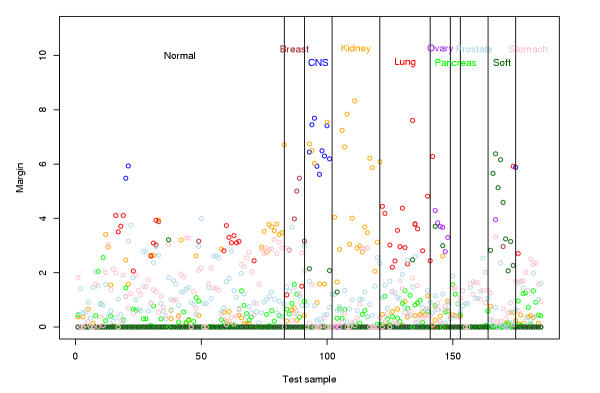
Margin for the test samples along with the label of the cluster which yields the largest margin. The vertical lines separate the actual classes of the test samples, while the color of the points illustrate the predicted class.

Margin for the test samples along with the label of the cluster which yields the largest margin. The vertical lines separate the actual classes of the test samples, while the color of the points illustrate the predicted class.