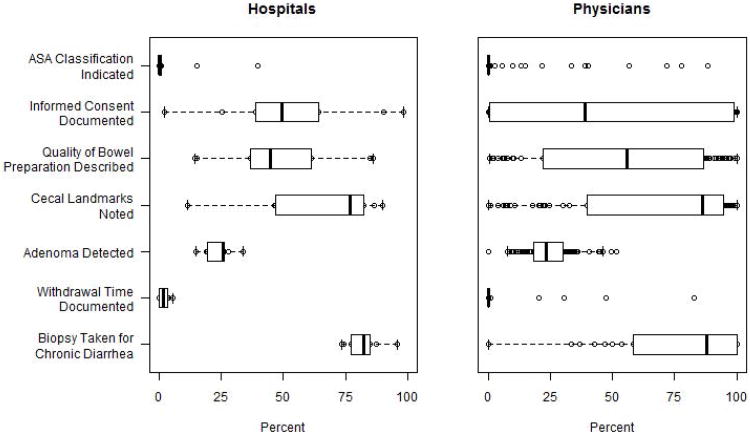
Figure 1. Performance on Quality Indicators for 9 Individual Hospitals and 77 Physicians with ≥30 Reports*.
*Heavy vertical line indicates median performance and the surrounding box represents the boundaries of the 25th and 75th percentile of performance. The extended horizontal line (“whisker”) extends one and a half times the interquartile range beyond the box. The individual circles mark the performance of providers whose performance is outside the boundaries of the box (i.e. the 25th and 75th percentile).

