
Figure 2.
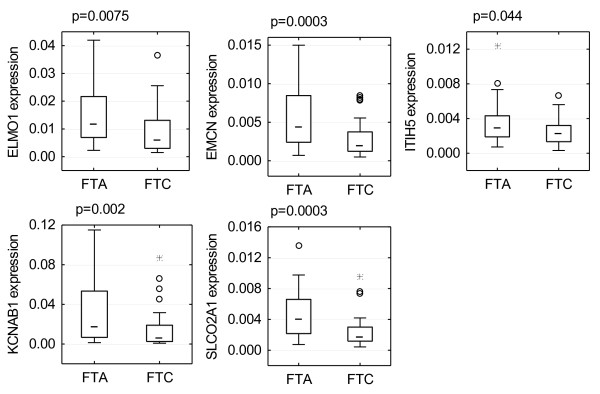
Boxplots for the validated genes ( ELMO1, EMCN, ITIH5, KCNAB1 , and SLCO2A1). All genes were under-expressed in follicular thyroid carcinoma (FTC) compared to follicular thyroid adenoma (FTA). All p-values were calculated using Mann–Whitney U test. The boxplots show following values: median: middle line; 25–75 percentile: box; non-outlying range: whiskers; outliers: circles; extreme values: stars.