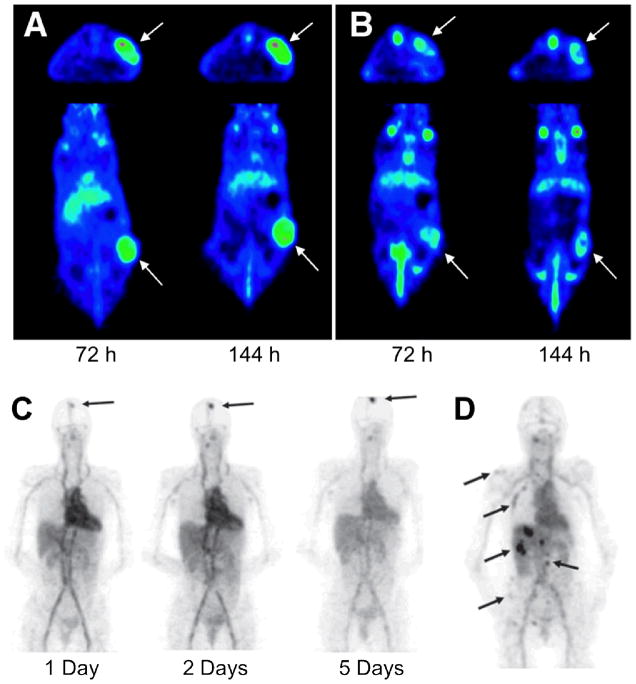
Fig. (2).
PET imaging of HER-2 expression with 89Zr-trastuzumab. Serial transverse and coronal PET images of a mouse administered with 89Zr-trastuzumab before (A) and after (B) three dosages of anticancer drug (HSP90 inhibitor) NVP-AUY922 are shown here. Arrows indicate the HER-2 positive tumors. (C) 89Zr-trastuzumab PET scans of a patient already on trastuzumab treatment at different time points post-injection revealed an increase over time of the tumor-to-nontumor ratio of tracer uptake. Arrow indicates 89Zr_trastuzumab uptake in the only lesion. (D) 89Zr-trastuzumab PET of a patient with liver and bone metastases at 5 days post-injection. A number of lesions are indicated by arrows. Adapted from [73, 80].

