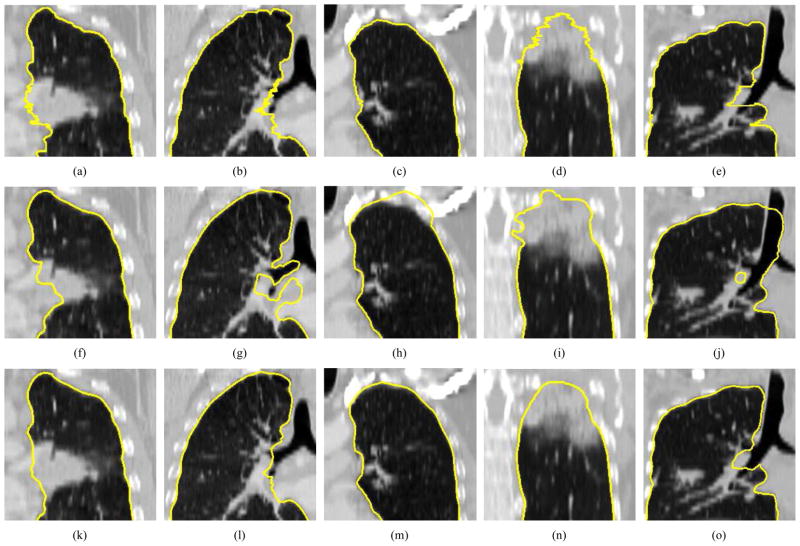
Figure 16.
Examples of segmentation results on five different data sets (columns). (a)–(e) Independent reference standard. Note that a zigzag pattern of the reference boundary can be observed on both the sagittal or coronal views, because the manual expert segmentation was performed in a slice-by-slice fashion and typically leads to slice-by-slice inconsistencies. (f)–(j) Initial automated OSF segmentation results. (k)–(o) Segmentation after 3-D refinement.

