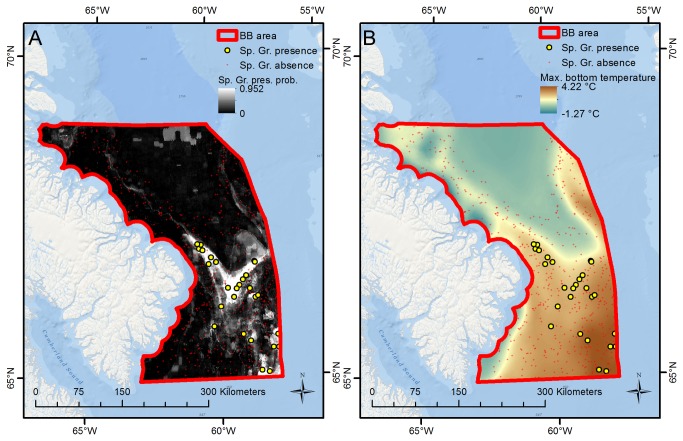
Figure 5. Spatial concordance between sponge grounds and maximum bottom temperature, BB subarea.
The figure shows (A) sponge ground presence/absence observations and predictions of presence probability, and (B) the distribution of maximum bottom temperature, for the BB subarea. Sponge grounds are primarily observed and predicted to exist in areas with high (>2.2 °C) maximum bottom temperature.

