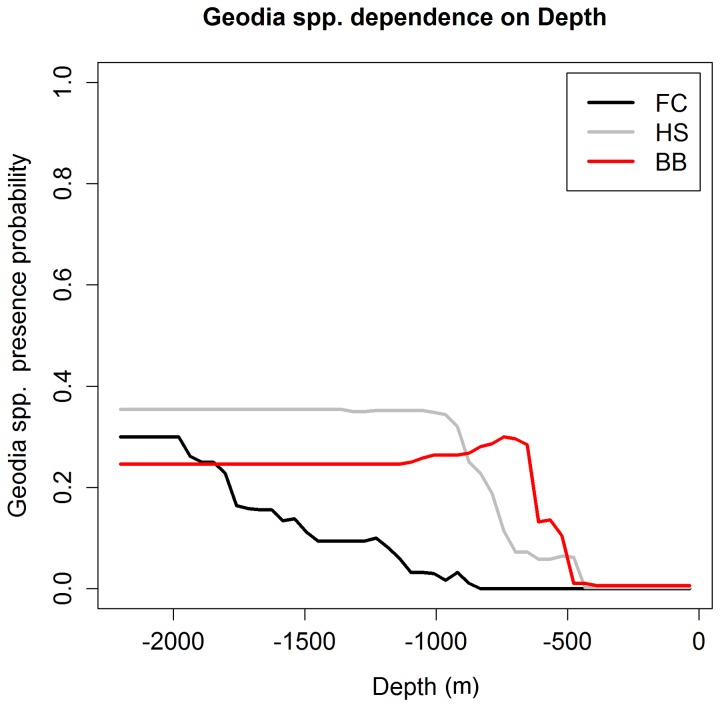
Figure 8. Geodia spp. presence probability dependence on depth for three subareas.
For each subarea (FC, HS and BB), the line shows predicted Geodia spp. presence probability when depth is varied through the full range of observations while all other predictors are held constant at their mean observed value.

