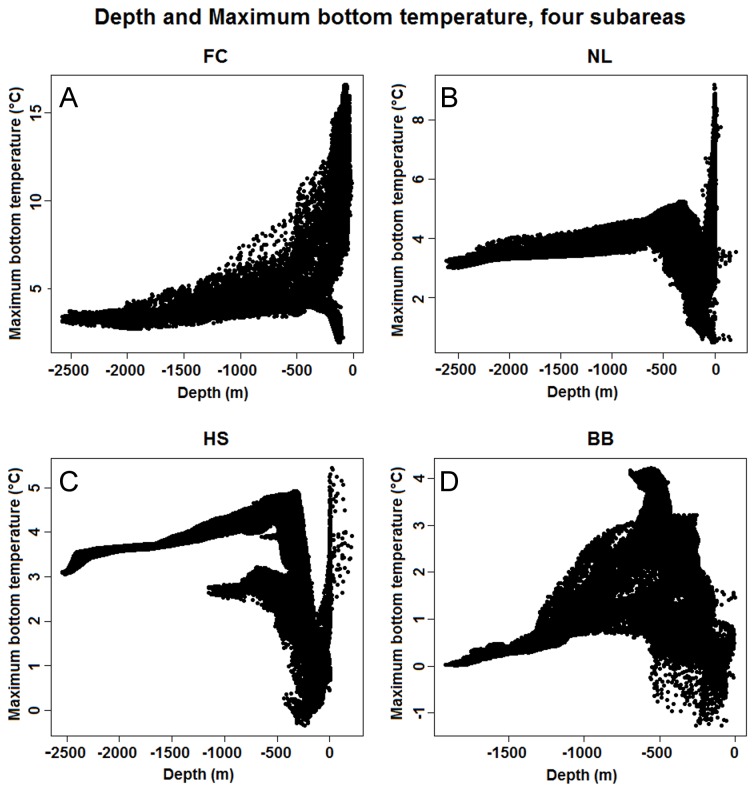
Figure 11. Varying relationships between depth and maximum bottom temperature.
The relationship between depth (a proxy predictor) and maximum bottom temperature (a potentially causal predictor) differs dramatically between the four subareas, probably causing depth to be a poor predictor of distributions when used in models extrapolated between areas. Note the different scale of the y-axes on each figure.

