
Figure 2.
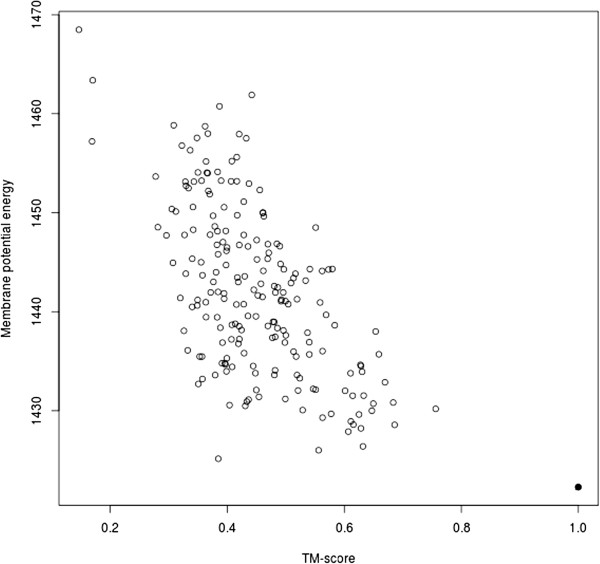
Scatter plot showing membrane potential energy against TM-score for cyotochrome c oxidase (PDB ID 2occA), Pearson’s r = -0.63. The model of the native structure is shown as a black square.
Official websites use .gov
A
.gov website belongs to an official
government organization in the United States.
Secure .gov websites use HTTPS
A lock (
) or https:// means you've safely
connected to the .gov website. Share sensitive
information only on official, secure websites.
Scatter plot showing membrane potential energy against TM-score for cyotochrome c oxidase (PDB ID 2occA), Pearson’s r = -0.63. The model of the native structure is shown as a black square.