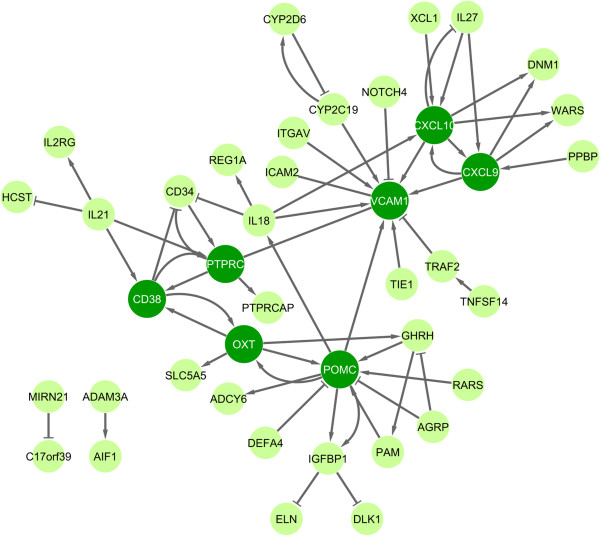
Figure 3.
Interaction network of genes differentially expressed in response to glatiramer acetate (GA). A gene interaction network was retrieved for the 463 filtered genes using the Pathway Studio software. The software delivered a network of 41 genes (= nodes) with 59 interactions (= edges) between them. The other genes with no interaction are not shown in the figure. Edges are represented in different ways in the network. An arrow (→) means positive effect (n = 43), a 'T’ (┤) means negative effect (inhibition, n = 14) and a line (─) means binding (n = 2). The seven nodes, which are highlighted in dark green, are involved in the regulation of many other genes and thus may play an important role in the molecular mechanisms of action of GA. The network is available as a Cytoscape session file from the authors upon request.

