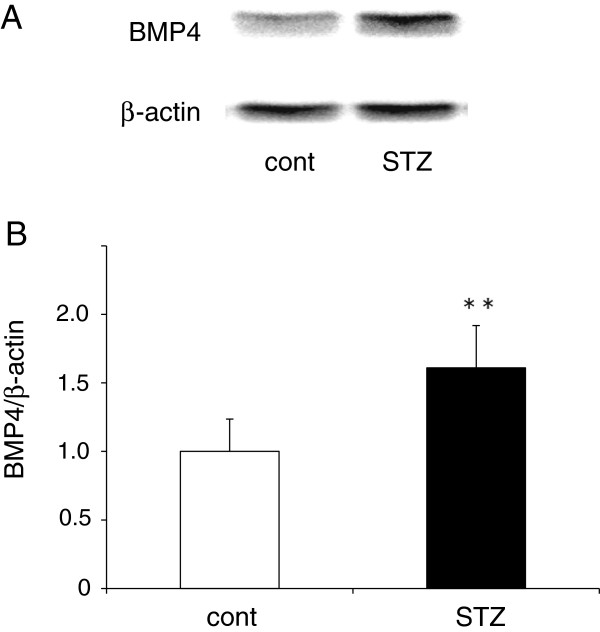
Figure 3.
BMP4 protein expression in the aorta. (A) Representative western blots showing BMP4 protein expression in the whole aortas from control (cont) and diabetic ApoE KO mice (STZ). (B) Scanning densitometry quantitative analysis of BMP4 protein expression (BMP4 protein/β-actin; n = 9 mice/group). Data are expressed as a ratio relative to the control group. Each bar indicates mean ± S.D.* *P < 0.01 vs control mice.

