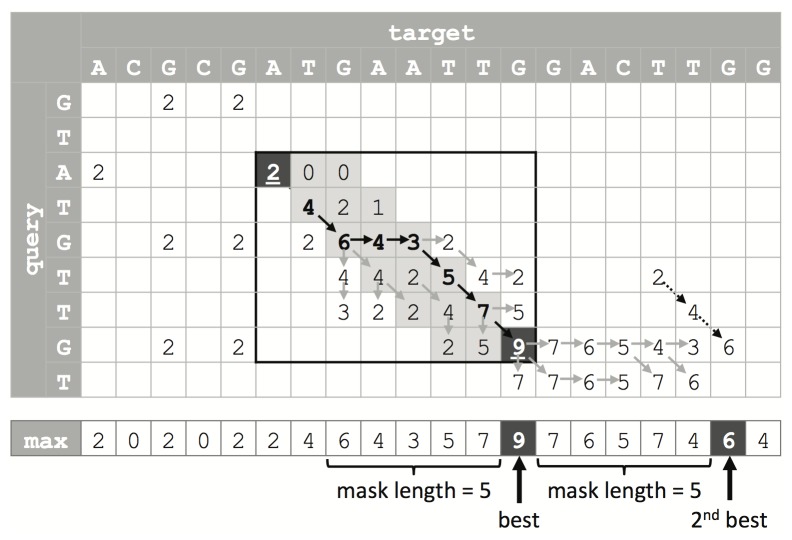
Figure 4. Illustration of alignment traceback and suboptimal alignment score determination.
An example SW score matrix is shown (penalties for match, mismatch, gap open and extension are 2, -1, -2, and -1 respectively). The bottom row indicates the maximum score for each column. The algorithm locates the optimal alignment ending position (the black cell with score 9) using the array of maximum scores, and then traces back to the alignment start position (the black cell with score 2) by searching a much smaller, locally computed score matrix (circled by the black rectangle). Finally, a banded SW calculates the detailed alignment by searching the shaded sub-region. The scores connected by solid arrows belong to the optimal alignment. The max array records the largest score of each column. After the optimal alignment score (marked by “best”) is found, its neighborhood is masked, and the second largest score is reported outside the masked region (marked by 2nd best). The scores connected by dashed-line arrows trace the suboptimal alignment.

