
Figure 2.
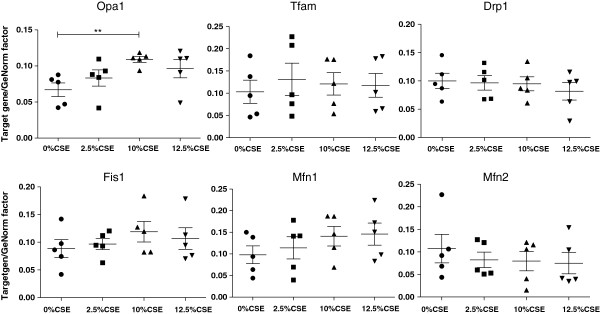
Expression of fission and fusion markers in long-term CSE exposed BEAS-2B cells. Cells were exposed to 0% CSE, 2.5% CSE, 10% CSE, 12.5% CSE (n = 5 for each group) for 6 months. RNA was isolated and fission and fusion markers were detected by qPCR. Ct values were obtained for the standard curve and each sample. Relative DNA starting quantities of samples were derived from the standard curve based on the Ct values using the iQ5 optical system software version 2.1. Genes of interest expression was normalized to a GeNorm factor obtained from the housekeeping genes RPLPO and RPL13a. Median interquartile ranges (IQR) are indicated. * = p < 0.05 between the indicated values.