
Figure 9.
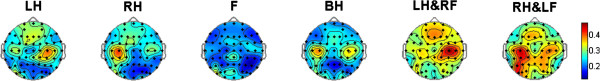
The topographical distribution based on q values for 6 mental tasks. Red regions indicate the activated areas during six types of motor imagery.
Official websites use .gov
A
.gov website belongs to an official
government organization in the United States.
Secure .gov websites use HTTPS
A lock (
) or https:// means you've safely
connected to the .gov website. Share sensitive
information only on official, secure websites.
The topographical distribution based on q values for 6 mental tasks. Red regions indicate the activated areas during six types of motor imagery.