
Figure 12.
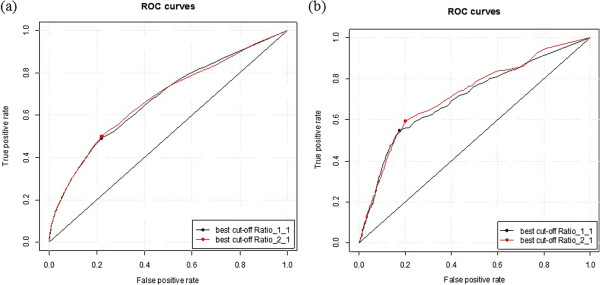
Performance of MFSPSSMpred on different ratios of training samples, tested on TEST419 (a) and TEST2012 (b). Red plots represent the result based on a training dataset with 1:2 ratio of MoRFs to non_MoRFs; the black plots represent the result based on a training dataset with 1:1 ratio of MoRFs to non_MoRFs.