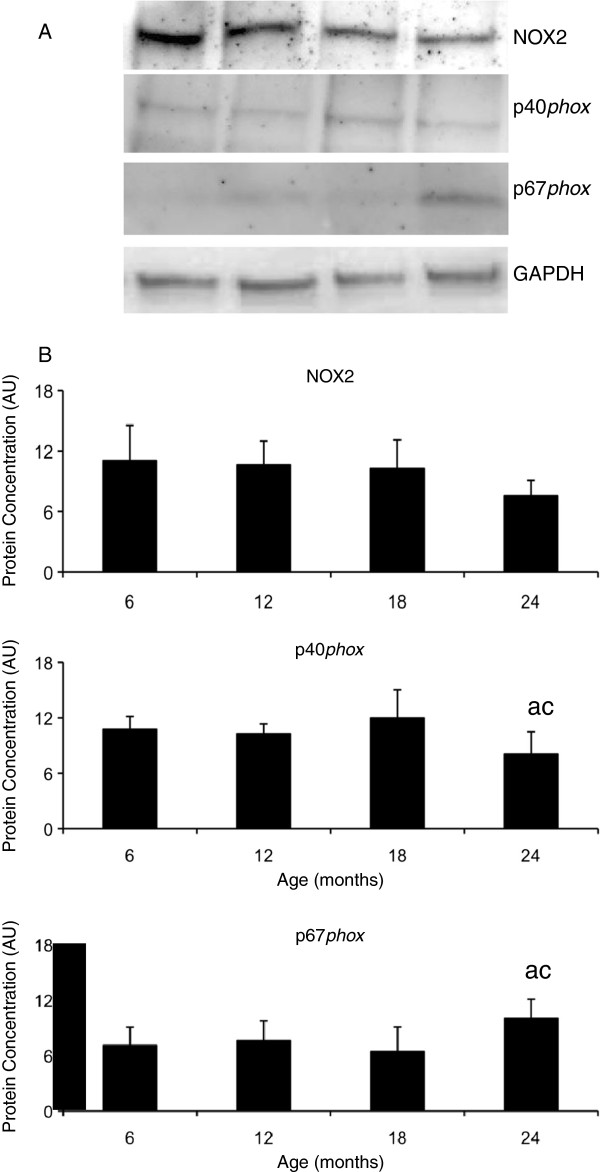
Figure 3.
The protein levels of the NOX2 enzyme subunits and protein levels in aging skeletal muscle. A. Representative blots for NOX2, p40phox, p67phox and GAPDH. B. Graphical representation of protein concentration expressed as arbitrary units (AU) after normalisation for GAPDH concentration. The values represent the mean ± SEM. Statistically significant differences (P < 0.05) between groups are indicated by lower case letters, where a = 6 m/o, b = 12 m/o, c = 18 m/o and d = 24 m/o.

