Figure 3.

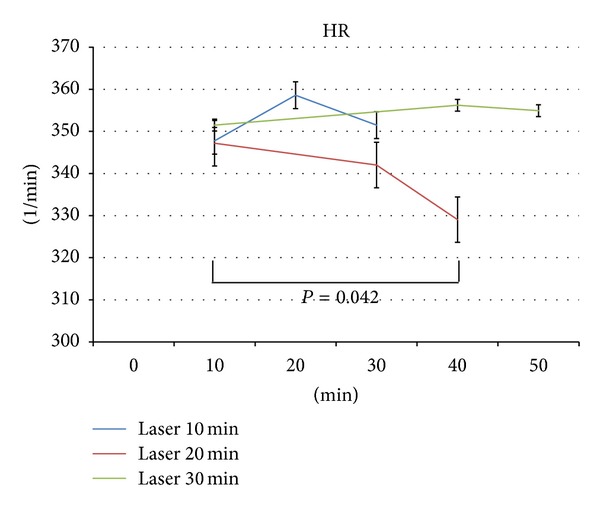
Mean heart rate (HR) of the 6 rats. Note the different stimulation durations (10, 20, and 30 min). Significant changes were only found for a duration of 20 min (red line). The error bars indicate the standard error (SE).

Mean heart rate (HR) of the 6 rats. Note the different stimulation durations (10, 20, and 30 min). Significant changes were only found for a duration of 20 min (red line). The error bars indicate the standard error (SE).