Figure 4.

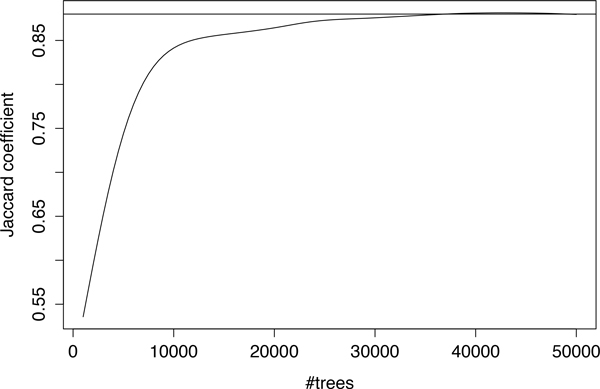
Jaccard coefficient plot. The Jaccard coefficient plot for the agreement of top 5,000 ranked SNPs with more trees added, the horizontal line is Jaccard coefficient = 0.88.

Jaccard coefficient plot. The Jaccard coefficient plot for the agreement of top 5,000 ranked SNPs with more trees added, the horizontal line is Jaccard coefficient = 0.88.