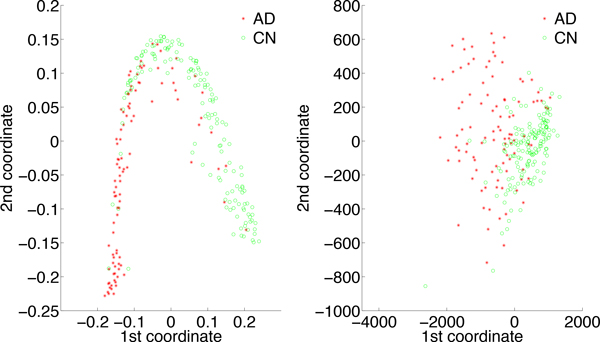
Figure 6.

Two-dimensional multidimensional scaling plots. (a) 2D representation of the AD and CN samples obtained from the pair-wise genetic distances estimated by PaRFR; (b) 2D representation of the AD and CN samples obtained from the pair-wise Euclidean distances of the multivariate neuroimaging phenotypes (148, 023 voxels). Sample clustering can be seen in both plots.
