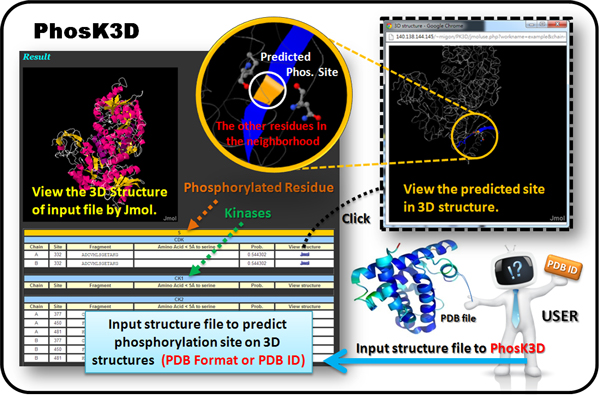
Figure 3.

The web interface of PhosK3D prediction system. The PhosK3D locates the predictive phosphorylation sites and the involved catalytic protein kinases. In order to reveal the characteristics of the phosphorylation sites including the phosphorylated residues and surrounding sequences, the training set of phosphorylation sites and constructed sequence logos corresponding to each protein kinase are also provided graphically on the web interface. Additionally, users can download the predicted results with tab-delimited format for further analyses. Since a PDB ID or structure file is inputted to PhosK3D, the sequential neighborhood (blue) and spatial neighborhood (gray) of the predicted phosphorylation sites (orange) are provided to users. Moreover, the positively charged residues (blue) and negatively charged residues (red) surrounding the predicted phosphorylation sites are physically presented by Jmol viewer.
