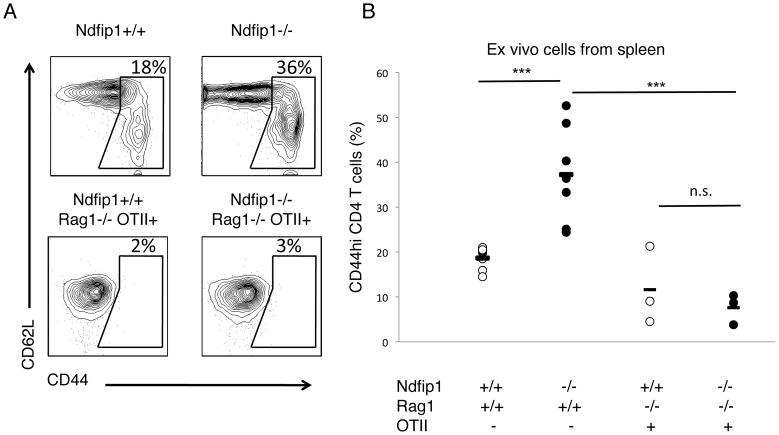
Figure 1. Activated phenotype of T cells in mice lacking Ndfip1 is antigen-dependent.
(A, B) Spleen cells were isolated from mice and analyzed by flow cytometry. Representative plots (A) or combined data (B) of CD4+ T cells from 3–7 mice per genotype. (A) Gate shown in plot illustrates how we define the percent of “activated” T cells. Numbers represent percentage of cells in gate. (B) Graph representing ‘activated’ phenotype cells illustrated in A. Each dot represents the percentage of cells in the spleen of a single mouse. Lines represent mean for each sample population and P values are for samples connected by the line. *** represents a P value of <0.001. n. s. stand for non-significant, with a P value greater than 0.05 based on a paired T test. This analysis was performed in at least three independent experiments.

