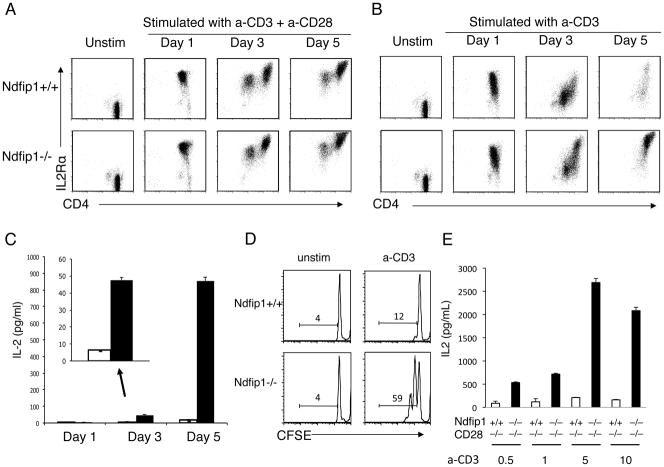
Figure 3. T cells lacking Ndfip1 can produce IL-2 and proliferate in the absence of CD28 co-stimulation.
(A–D) Naïve (CD44loCD62LhiCD25−) CD4+ T cells were isolated from Ndfip1−/− mice or Ndfip1+/+ littermate controls and stimulated in vitro with anti-CD3 and anti-CD28 (A) or anti-CD3 only (B–E). (A and B) Cells were analyzed for levels of IL-2Rα by flow cytometry at the indicated time points. Plots are representative of three independent experiments from 3 mice of each genotype. (C) Supernatants were analyzed for IL-2 by ELISA at time points indicated. Graphs are of representative data from three independent experiments, showing a single comparison of genotypes performed in triplicate. White bars represent cultures of Ndfip1+/+ T cells and black bars show Ndfip1−/− T cells. Bars represent the mean and lines show the standard deviation of the triplicate samples. (D) Cells described in panel B were labeled with CFSE immediately prior to stimulation and analyzed at day three for proliferation. Histograms showing CFSE dilution are representative of at least three independent experiments. (E) IL-2 levels in cultures of Ndfip1+/+CD28−/− and Ndfip1−/−CD28−/− T cells stimulated with various concentrations of anti-CD3 as noted and analyzed at day three. White bars are Ndfip1+/+CD28−/− T cells and black bars are Ndfip1−/−CD28−/− T cells. Bars represent the mean and lines show the standard deviation of the triplicate samples.

