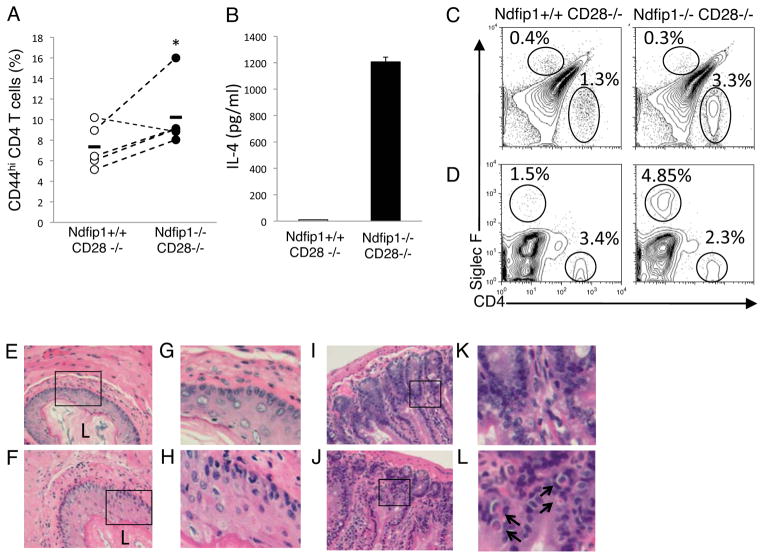
Figure 4. T cells in mice lacking both Ndfip1 and CD28 become activated, make IL-4 and migrate into the gastrointestinal tract.
(A) Percentages of activated phenotype cells among the CD4+ cells in the spleens of 5–10 wk old Ndfip1−/− CD28−/− mice or Ndfip1+/+CD28−/− littermate controls. Each dot represents a single mouse and data are representative of 4 independent experiments. Dots connected by lines show age matched littermate pairs in each experiment. * represents a P value of <0.05 based on a paired T test. (B) Cells were isolated from spleens of mice and stimulated overnight with anti-CD3. IL-4 in the supernatants was determined using ELISA. Data are representative of three independent experiments from three mice of each genotype. Bars represent the mean and error bars indicate standard deviation of three triplicate samples. (C and D) Cells isolated from esophagus (C) and small bowel (D) following collagenase treatment were analyzed by flow cytometry for eosinophils (SiglecF+) or T cells (CD4+). Representative plots from at least three independent experiments are shown. (E-H) Sections of esophagus from Ndfip1+/+CD28−/− mice (E and G) or Ndfip1−/−CD28−/− mice (F and H). E and F were taken at 20X magnification, while G and H are insets depicted by boxed regions in E and F. Epithelial thickening can be seen in G and H. L indicates the lumen for visual reference. Representative of three mice of each genotype from three independent experiments. (I-L) Sections of small bowel from Ndfip1+/+CD28−/− mice (I and K) or Ndfip1−/−CD28−/− mice (J and L). I and J were taken at 20X magnification, while K and L are insets depicted by boxed regions in I and J. Eosinophils can be seen in insets and are indicated by arrows. Representative of three mice of each genotype from three independent experiments.

