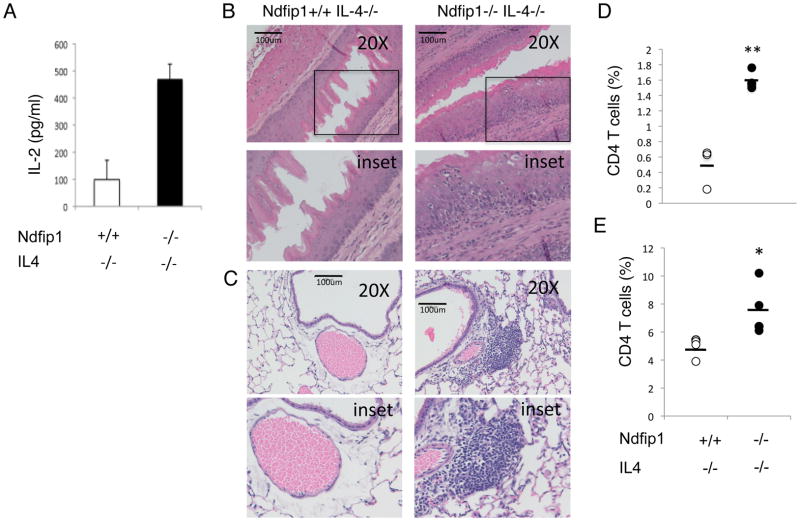
Figure 9. Ndfip1−/− IL-4−/− T cells produce high levels of IL-2 and promote inflammation.
(A) IL-2 production from Ndfip1+/+IL-4−/− or Ndfip1−/−IL-4−/− T cells stimulated with anti-CD3 as measured by ELISA. Data are representative of three independent experiments from at least three mice of each genotype. (B–D) Cells isolated from the esophagus of Ndfip1+/+IL-4−/− and Ndfip1−/−IL-4−/− mice analyzed by flow cytometry. (B and C) Representative sections of esophagus (B) and lung (C) from Ndfip1+/+IL-4−/− and Ndfip1−/−IL-4−/− mice. Bars illustrate 100 microns and lower panels represent inset shown in upper panels. Similar results were observed in the sections from three mice analyzed from each genotype. (D) Cells were isolated from esophagi from Ndfip1+/+IL-4−/− and Ndfip1−/−IL-4−/− mice. Cells were analyzed using flow cytometry for percentages of T cells among live-gated cells. Data were combined from three independent experiments using a total of three mice of each genotype. Bars are mean values of T cells (CD4+) (E). Cells isolated from lungs from Ndfip1+/+IL-4−/− and Ndfip1−/−IL-4−/− mice were analyzed by flow cytometry for percentages of T cells among live-gated cells. Data were combined from three independent experiments using a total of four mice of each genotype. Bars are mean values of T cells (CD4+) Each dot represents a single mouse. * represents a P value of <0.05 based on a paired T test while ** represents P<0.01.

