
Figure 1.
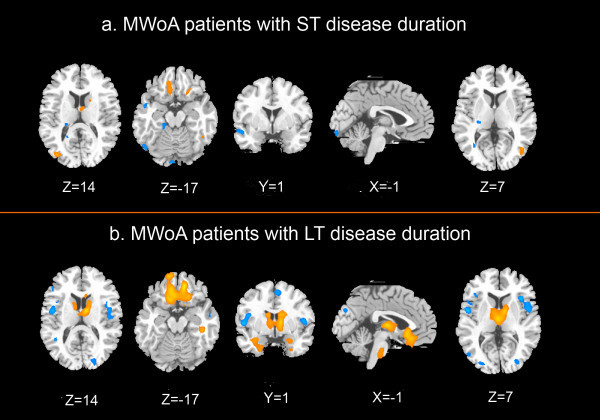
Differences between MWoA patients and healthy subjects in ReHo values. a. MWoA patients with ST disease duration; b. MWoA patients with LT disease duration; p < 0.01, FDR corrected; Warm colors indicate ReHo increases in MWoA patients; cool colors indicate ReHo decreases in MWoA patients.