
Figure 2.
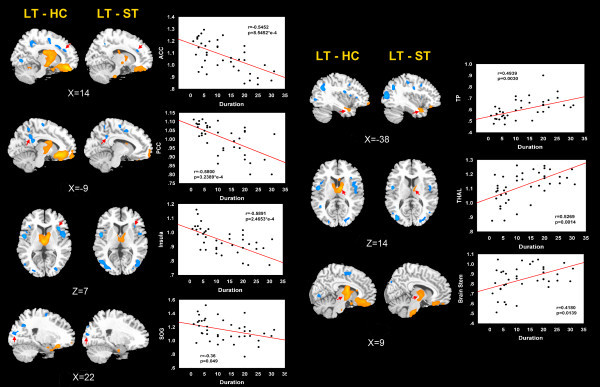
The correlation of average ReHo values of the overlapped brain dysfunction in LT vs HC and LT vs ST with the disease duration. Warm colors indicate ReHo increases in MWoA patients; cool colors indicate ReHo decreases in MWoA patients; ACC, anterior cingulate cortex; THAL, thalamus; TP, temporal pole; PCC, posterior cingulate cortex; SOG, superior occipital gyrus; LT, MWoA patients with long-term disease duration; ST, MWoA patients with short-term disease duration; HC, healthy controls.