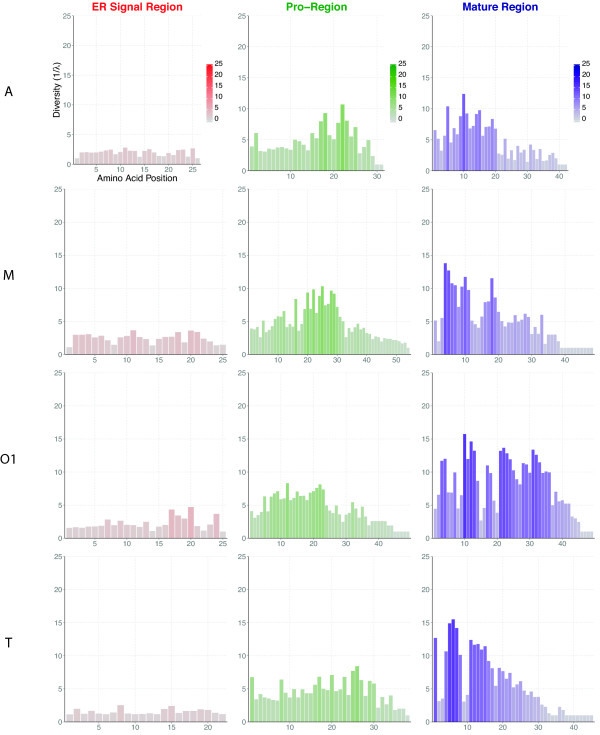
Figure 1.
Amino acid diversity in conopeptides. The position-specific diversity of amino acid for each conopeptide regions (ER signal in red, pro- in green, and mature region in purple) belonging to the 4 largest gene superfamilies A, M, O1 and T (the remaining superfamilies are presented in Additional file 1: Figure S1). The true diversity of order 2 (or inverse Simpson index, 1/λ) have been calculated according to the following equation in order to take into account the amino acid richness R, their average proportional abundance pi, as well as the variability of sequence lengths for each regions: . For each amino acid position, a color gradient applies to the diversity index (from 0 in light to higher values in darker color).

